- 01Read HRV as your own trend
Population averages are so wide (two healthy people of the same age can differ by 30 ms) and devices measure so differently (SDNN vs RMSSD, daytime vs overnight) that the only number worth reading is your own 7-day average against your own baseline. A sustained drop below your normal band means something; a single low night or a lower number than a friend's does not.
Heart rate variability (HRV) is the change in time from one heartbeat to the next, measured in milliseconds. A healthy heart beating at 60 beats per minute does not tick once every 1.00 seconds; the gaps run something like 0.92, 1.05, 0.98 seconds. That spread is HRV. A bigger spread at rest usually means your nervous system is relaxed and recovered, and a smaller spread than your own normal usually means your body is under some kind of load.
What is heart rate variability?
Your heart has its own pacemaker that would fire about 100 times a minute if left alone. Two branches of the nervous system adjust it. The sympathetic branch is the accelerator, and the parasympathetic branch, mostly through the vagus nerve, is the brake. The vagal brake acts within a single beat, so when it is active it nudges each interval slightly longer or shorter. That beat-to-beat adjustment is what HRV picks up.
The clearest example is breathing. Your heart speeds up a little on the in-breath and slows on the out-breath, a pattern called respiratory sinus arrhythmia (a normal rhythm, despite the name). The stronger the vagal brake, the bigger that swing, and the higher your HRV. Stress, illness and exhaustion push the accelerator and ease off the brake, so the beats become more even and HRV drops.
How a calm nervous system turns into a high HRV number
HRV vs resting heart rate
Resting heart rate counts how many beats you have in a minute. HRV measures how unevenly those beats are spaced. Two people can both sit at 58 beats per minute while one has an HRV of 25 ms and the other 70 ms. On a well-rested morning, resting heart rate tends to be lower and HRV higher; after a night of drinking or the start of a cold, heart rate tends to rise and HRV to fall. Reading the two together is more reliable than reading either one alone.
Read beside your HRV
RMSSD, SDNN and the other letters on your app
The 1996 Task Force of the European Society of Cardiology and the North American Society of Pacing and Electrophysiology set the measures still used today 1. Two measures, both worked out straight from the gaps between beats, matter for wearables. RMSSD (root mean square of successive differences) looks at the difference between each beat and the next, so it reflects short-term, vagal activity. SDNN (standard deviation of the intervals) looks at the overall spread across the whole recording, so it mixes vagal and slower influences and grows with recording length 2.
RMSSD is the standard estimate of vagal HRV for short and overnight readings, and it is less affected by breathing rate than the frequency measures 2. Some apps also show those frequency measures, which split the heartbeat pattern into fast and slow waves. HF (the fast, breathing-linked wave) mostly reflects the vagal brake; LF (the slower wave) mixes both branches with blood pressure control 1. Because LF is not a pure accelerator signal, the popular LF/HF "stress balance" ratio is disputed 2, so treat it with caution.
| Device | Metric reported | When it measures | Compare it with |
|---|---|---|---|
| Apple Watch | SDNN | Short spot readings through the day and night, plus Breathe sessions | Your own Apple readings only |
| Oura ring | RMSSD | Overnight, averaged across sleep | Your own overnight Oura average |
| Whoop | RMSSD | During sleep, weighted to the last deep-sleep period | Your own Whoop recovery trend |
| Garmin | RMSSD | Overnight, shown against a personal baseline band (HRV Status) | Your own Garmin baseline band |
| Chest strap with an HRV app | RMSSD (often as lnRMSSD, RMSSD put on a log scale, which evens out big day-to-day swings) | A 1 to 5 minute reading on waking | The same reading, same position, same time each morning |
What is a good HRV for my age?
There is no single good HRV. Across pooled studies of healthy adults, short-term resting RMSSD averaged about 42 ms and SDNN about 50 ms 3. With a standard deviation of about 15 ms, most healthy adults fall roughly between 15 and 70 ms RMSSD 3. Genetics, fitness, body position and the time of measurement all shift the number, so two equally healthy 40-year-olds can differ by 30 ms.
HRV falls with age, and RMSSD falls fastest, mostly between your 20s and 50s; differences between men and women shrink after about 50 2. A 65-year-old at 25 ms RMSSD may be entirely typical, while the same number in a fit 25-year-old would be worth a second look at sleep, training and alcohol.
If you have seen "below 50 ms is depressed" online, that cutoff does not apply to your watch. The Task Force standards describe a 24-hour SDNN below 50 ms as markedly depressed and 50 to 100 ms as moderately depressed, measured on a Holter monitor (a 24-hour wearable ECG), mainly in people after a heart attack 1. A 24-hour SDNN is a different number from a one-minute watch SDNN.
Is high HRV good? Is low HRV bad?
On average, yes. In a meta-analysis of people without known heart disease, low HRV was linked with roughly a 32 to 45% higher risk of a first cardiovascular event 4. Low HRV also shows up alongside depression, diabetes and poor fitness. Those are population links: a low HRV on your ring is a signal to look at sleep, alcohol, training and health, and on its own it does not diagnose heart disease.
A high HRV can be a false signal. HRV assumes every beat comes from the heart's normal pacemaker. Atrial fibrillation, frequent extra beats (ectopic beats) and other irregular rhythms make the gaps erratic, and an app reads that chaos as very high variability. A sudden jump to an HRV far above your usual range, especially with a raised heart rate, deserves the same attention as a drop.
Palpitations alone are often harmless. As our <a href="/symptoms/heart-palpitations">heart palpitations</a> guide puts it, they "are common and usually not serious", yet in one series of 190 people checked for them, the cause was in the heart in 43%, which is why anyone assessed gets an ECG. For what an irregular reading means, see <a href="/biomarkers/heart-rhythm">heart rhythm</a>.
HRV and stress, anxiety and mood
HRV and stress are closely tied. A deadline, a row or a night of worry presses the accelerator and lifts off the vagal brake, so HRV dips for hours. When stress runs on for weeks, the brake can stay lighter for longer, and resting HRV settles lower. Two other systems tend to move with it: the stress hormone axis (the HPA axis, which releases cortisol) and low-grade inflammation. These run alongside a low HRV in studies; they are associations, and nobody has shown which one drives the others.
Mood shows the same pattern. In a meta-analysis, people with depression had lower HRV than people without it, and the more severe the depression, the lower the HRV 5. The same stressor also hits people differently: fitness, sleep debt and how much you replay a problem afterwards all change how far and how long HRV falls. For what lowers the stress load itself, see <a href="/learn/how-to-lower-cortisol">how to lower cortisol</a>, and for the evidence on supplements marketed for it, <a href="/supplements-for/lower-cortisol">supplements for lower cortisol</a>.
Why did my HRV drop? The usual causes
A one- or two-night drop almost always has an ordinary cause. Check these first:
- Alcohol. In about 4,000 Finnish adults wearing a heart monitor, alcohol lowered HRV during the first hours of sleep, the more people drank the bigger the drop, and even low doses had a measurable effect 6.
- Short or broken sleep. See <a href="/learn/is-5-hours-of-sleep-enough">is 5 hours of sleep enough</a> and <a href="/symptoms/cant-sleep">can't sleep</a>.
- A hard training session or block, especially intervals or a long race.
- Illness coming on. In some people, HRV falls and resting heart rate rises before symptoms appear.
- A large or late meal, heat, dehydration, travel and jet lag.
- The menstrual cycle. Vagal HRV is lower in the second half of the cycle (the luteal phase) than in the first, according to a meta-analysis of within-person studies 7.
- Acute psychological stress, a deadline or a bad night's worry; see <a href="/learn/how-to-lower-cortisol">how to lower cortisol</a> for what helps.
When HRV stays low for weeks with none of those explanations, medical causes are worth ruling out: an overactive thyroid (<a href="/conditions/hyperthyroidism">hyperthyroidism</a>), <a href="/conditions/anemia">anemia</a>, poor blood sugar control (<a href="/conditions/insulin-resistance">insulin resistance</a> or diabetes) and ongoing inflammation can all push HRV down.
How to read your wearable's HRV without overreacting
- 1Measure the same way every timeOvernight with a ring or watch, or the same 1 to 5 minute reading on waking with a chest strap. Do not mix daytime spot checks with night averages.
- 2Give it 2 to 4 weeksYour baseline is your normal range across ordinary weeks, including some late nights and some good ones.
- 3Judge the 7-day averageIn elite endurance athletes, a 7-day rolling average of RMSSD (on a log scale) tracked fitness and fatigue better than single-day values 8.
- 4Act on a sustained dropSeveral days below your normal band, together with a higher resting heart rate or feeling run down, is a signal. One low night after a wedding is not. If a drop comes with palpitations, chest pain, breathlessness on light effort or fainting, see a doctor rather than adjusting training.
Athletes use this to adjust training: a 7-day average inside the band supports the planned session, and a sustained drop suggests an easier day. If you train by heart rate, the <a href="/calculators/heart-rate-zones">heart rate zones calculator</a> and <a href="/calculators/vo2-max">VO2 max calculator</a> sit well beside your HRV trend. The same rule holds for lab results, as <a href="/learn/trends-beat-single-readings">why a trend beats a single reading</a> explains. More on training and recovery in <a href="/for/body-performance">body performance</a>.
How to raise your HRV: what works
The ways to increase HRV below run roughly from the most evidence to the least. Sleep, training and alcohol do most of the work; supplements come last.
| Lever | What the evidence shows |
|---|---|
| Regular aerobic exercise | In a meta-analysis of training studies, exercise programmes raised vagal HRV and lowered resting heart rate in healthy people 9 |
| Less alcohol | Overnight HRV falls in step with the amount drunk 6 |
| Consistent, sufficient sleep | Regular bed and wake times go with higher, steadier overnight readings in wearable data; few trials have tested it directly |
| Slow breathing near 6 breaths a minute | Raises HRV while you do it; in a meta-analysis, regular practice (HRV biofeedback) reduced self-reported stress and anxiety 10 |
| Weight loss and blood sugar control | Linked with better HRV in people with excess weight or insulin resistance; the evidence is mostly observational |
| Omega-3 fish oil | A small increase in high-frequency (vagal) HRV in a meta-analysis of randomised trials 11 |
| Magnesium | Relevant mainly if you are low; little evidence in people with normal levels |
For sleep itself, the <a href="/calculators/sleep">sleep calculator</a> helps you set a consistent bedtime and wake time, and our <a href="/for/sleep">sleep guide</a> covers the rest. If you are considering supplements, the two with any HRV evidence are below, and both are small levers next to sleep, training and alcohol. If sleep is the real problem, <a href="/compounds/magnesium/for-sleep">magnesium for sleep</a> is the more useful read. Check with your doctor or pharmacist first: fish oil can add to bleeding risk if you take a blood thinner or antiplatelet, and high doses have been linked to a higher risk of atrial fibrillation; magnesium supplements are not suitable for people with kidney disease. Neither treats or prevents heart disease.
Supplements with some HRV evidence

Blood tests that explain a stubbornly low HRV
If your HRV has sat below your old normal for a month despite good sleep, steady training and little alcohol, a handful of blood tests have a real mechanism behind them. A doctor can decide which apply to you. An abnormal result needs interpreting by a clinician alongside your symptoms and history.
Labs with a reason to check
Two more are worth raising if the first three are normal. <a href="/biomarkers/fasting-insulin">Fasting insulin</a> can show insulin resistance before A1c rises, and <a href="/biomarkers/hs-crp">hs-CRP</a> picks up the low-grade inflammation that tracks with low HRV. Morning <a href="/biomarkers/cortisol">cortisol</a> is only worth testing when a doctor suspects an adrenal problem such as Cushing's syndrome; a single cortisol result does not explain a low HRV in otherwise healthy people. If stress is the likelier driver, <a href="/learn/how-to-lower-cortisol">how to lower cortisol</a> covers the habits that help.
What to say to your doctor: "My resting HRV has been below my usual range for about a month despite good sleep and little alcohol, and my resting heart rate is up. Could we check TSH, a full blood count, HbA1c and hs-CRP?"
Free, no accountRead your blood testHave recent blood results? See which of them bear on a low HRV.Read my results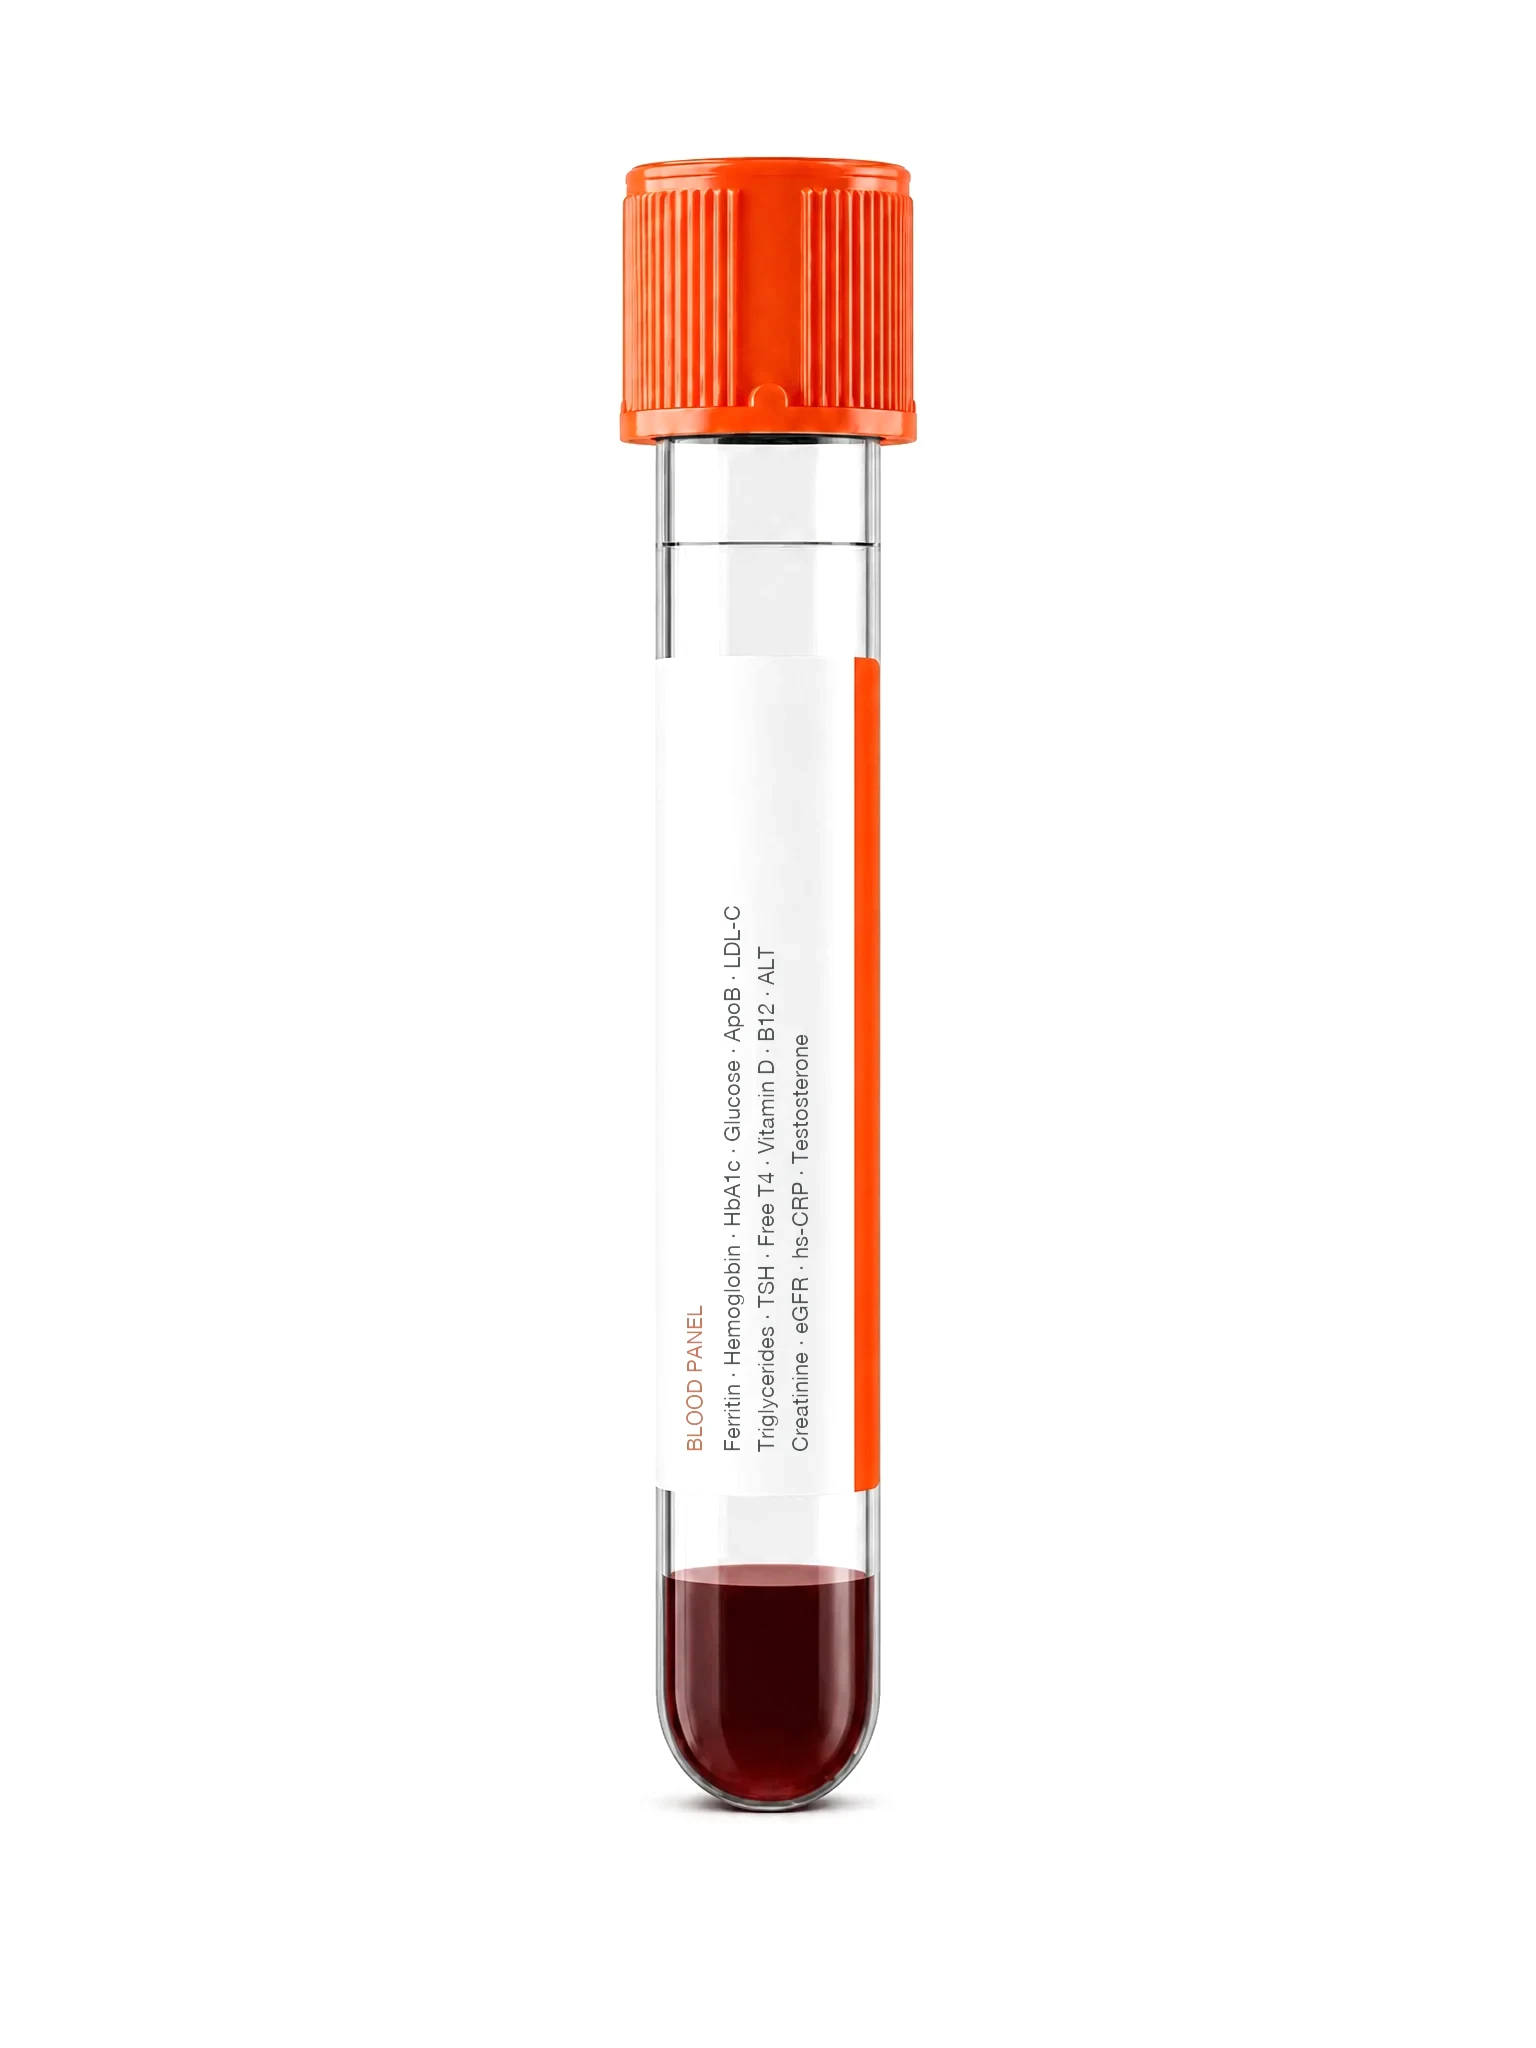

Citations
- Task Force of the European Society of Cardiology and the North American Society of Pacing and Electrophysiology (1996). Heart rate variability: standards of measurement, physiological interpretation and clinical use. Circulation 93:1043-1065.
- Shaffer F, Ginsberg JP (2017). An overview of heart rate variability metrics and norms. Frontiers in Public Health 5:258.
- Nunan D, Sandercock GRH, Brodie DA (2010). A quantitative systematic review of normal values for short-term heart rate variability in healthy adults. Pacing and Clinical Electrophysiology 33:1407-1417.
- Hillebrand S et al. (2013). Heart rate variability and first cardiovascular event in populations without known cardiovascular disease: meta-analysis and dose-response meta-regression. Europace 15:742-749.
- Kemp AH et al. (2010). Impact of depression and antidepressant treatment on heart rate variability: a review and meta-analysis. Biological Psychiatry 67:1067-1074.
- Pietila J et al. (2018). Acute effect of alcohol intake on cardiovascular autonomic regulation during the first hours of sleep in a large real-world sample of Finnish employees. JMIR Mental Health 5(1):e23.
- Schmalenberger KM et al. (2019). A systematic review and meta-analysis of within-person changes in cardiac vagal activity across the menstrual cycle: implications for female health and future studies. Journal of Clinical Medicine 8(11):1946.
- Plews DJ, Laursen PB, Stanley J, Kilding AE, Buchheit M (2013). Training adaptation and heart rate variability in elite endurance athletes: opening the door to effective monitoring. Sports Medicine 43:773-781.
- Sandercock GRH, Bromley PD, Brodie DA (2005). Effects of exercise on heart rate variability: inferences from meta-analysis. Medicine and Science in Sports and Exercise 37:433-439.
- Lehrer P et al. (2020). Heart rate variability biofeedback improves emotional and physical health and performance: a systematic review and meta analysis. Applied Psychophysiology and Biofeedback 45:109-129.
- Xin W, Wei W, Li X (2013). Short-term effects of fish-oil supplementation on heart rate variability in humans: a meta-analysis of randomized controlled trials. American Journal of Clinical Nutrition 97:926-935.
Educational context only, not medical advice or a diagnosis. Always discuss your results with a clinician.